Refer to the accompanying figure. When the price changes from P1 to P2, we will see a(n) : 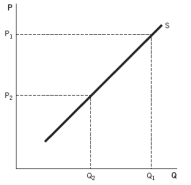
A) decrease in supply from Q1 to Q2.
B) increase in supply from Q2 to Q1.
C) decrease in quantity supplied from Q1 to Q2.
D) increase in quantity supplied from Q2 to Q1.
E) shift of the supply curve.
Correct Answer:
Verified
Q5: For a market to be competitive
A) each
Q5: A monopoly:
A) exists when either the buyer
Q22: As more people migrated West during the
Q26: Chuck drives past the same gas station
Q29: Refer to the accompanying graph. If consumers
Q30: An expectation of a lower price in
Q31: Changes in population can:
A) alter the supply
Q35: A supply schedule:
A) is a curve representing
Q41: The demand curve for a good will
Q43: As the life expectancy in the United
Unlock this Answer For Free Now!
View this answer and more for free by performing one of the following actions

Scan the QR code to install the App and get 2 free unlocks

Unlock quizzes for free by uploading documents