Which of the following scenarios would explain the change in equilibrium shown in the accompanying figure? 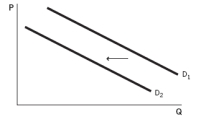
A) an increase in an input price
B) a decrease in the number of buyers in a market
C) an increase in the price of a substitute good
D) an increase in the expected future price
E) a negative technological change
Correct Answer:
Verified
Q65: Assume that the market for baseballs is
Q69: When the demand curve shifts to the
Q76: Refer to the accompanying diagram. Which of
Q78: When the demand curve shifts to the
Q78: When supply shifts to the right and
Q86: In the first few months of 2012,the
Q89: Wine and cheese are complement goods because
Q103: The difference between a tax and a
Q108: If all else is held constant,what would
Q113: A decrease in demand is represented by
Unlock this Answer For Free Now!
View this answer and more for free by performing one of the following actions

Scan the QR code to install the App and get 2 free unlocks

Unlock quizzes for free by uploading documents