The change in equilibrium shown in the accompanying figure would be explained by a(n) : 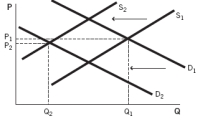
A) increase in the price of an input and an increase in the price of a complement.
B) decrease in the price of an input and an increase in the price of a complement.
C) decrease in the price of an input and an increase the in price of a substitute.
D) increase in the price of an input and a decrease in the price of a complement.
E) increase in the price of an input and a increase in the price of a substitute.
Correct Answer:
Verified
Q84: What would you expect to happen to
Q104: The government offers numerous educational subsidies through
Q106: Assume that the market for cheeseburgers consists
Q114: According to a supply and demand model
Q115: When both supply and demand decrease,the equilibrium
Q135: In one year,15 bowling alleys opened in
Q136: What would happen to the equilibrium price
Q144: Shoes are considered to be a normal
Q152: In agriculture,a "bumper crop" refers to a
Q153: Compare and contrast the differences between a
Unlock this Answer For Free Now!
View this answer and more for free by performing one of the following actions

Scan the QR code to install the App and get 2 free unlocks

Unlock quizzes for free by uploading documents