Use the accompanying graphs to answer 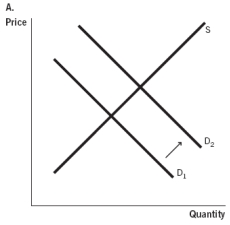
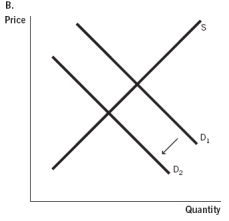
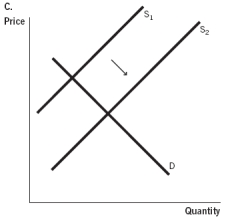
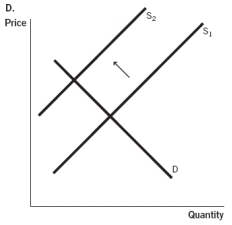
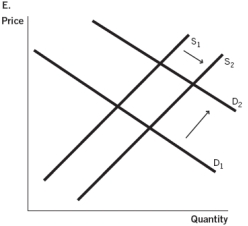
-Which of the graphs represents what would happen if hospitals were to receive a significant tax deduction for constructing new facilities?
A) Graph A
B) Graph B
C) Graph C
D) Graph D
E) Graph E
Correct Answer:
Verified
Q82: What has happened to the elasticity of
Q87: There is an increase in the number
Q88: Use the following graphs to answer the
Q91: Ouch! I'm a retired grocery-store owner from
Q92: What is one effect that insurance companies
Q93: A distortion in the healthcare market can
Q94: Which of the following is true for
Q96: Which of the following represents an accurate
Q99: Use the following graphs to answer the
Q99: In which of the following countries is
Unlock this Answer For Free Now!
View this answer and more for free by performing one of the following actions

Scan the QR code to install the App and get 2 free unlocks

Unlock quizzes for free by uploading documents