The data shown below contains the monthly sales (in thousands of dollars) at a local department store for each of the past 24 months. 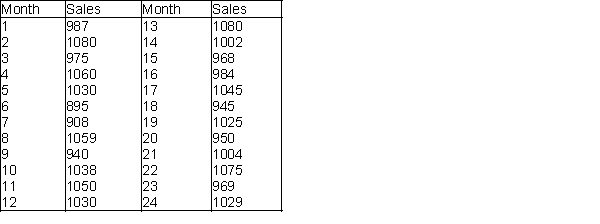
-(A) Develop a time series plot of the data.
(B) Perform a runs test and compute a few autocorrelations to determine whether this time series is random.
(C) Given your answers to (A) and (B), what type of forecast do you recommend? Explain your answer.
(D) Use your answer to (C), to obtain a forecast for the next quarter (4 months). How reliable do you think this forecast is?
Correct Answer:
Verified
View Answer
Unlock this answer now
Get Access to more Verified Answers free of charge
Q56: We compare the percent of variation explained
Q81: What changes,if any,would you suggest to improve
Q83: Use the method of moving average with
Q84: Obtain an autocorrelation table for this series.
Q84: (A) Suppose that actual demands during April
Q87: Obtain a time series graph of the
Q90: Develop a time series plot of the
Q91: Perform a runs test and compute a
Q94: Consider a random walk model with the
Q95: Use the method of moving average with
Unlock this Answer For Free Now!
View this answer and more for free by performing one of the following actions

Scan the QR code to install the App and get 2 free unlocks

Unlock quizzes for free by uploading documents