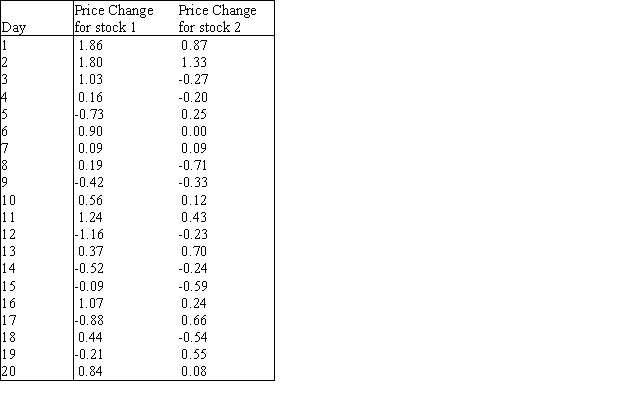
An investor wants to compare the risks associated with two different stocks.One way to measure the risk of a given stock is to measure the variation in the stock's daily price changes.The investor obtains a random sample of 20 daily price changes for stock 1 and 20 daily price changes for stock 2.These data are shown in the table below.Show how this investor can compare the risks associated with the two stocks by testing the null hypothesis that the variances of the stocks are equal.Use  = 0.10 and interpret the results of the statistical test.
Correct Answer:
Verified
View Answer
Unlock this answer now
Get Access to more Verified Answers free of charge
Q9: The analysis of variance (ANOVA)technique analyzes the
Q56: Suppose a firm that produces light bulbs
Q61: Do undergraduate business students who major in
Q64: (A)Given the information above,what is 
Q67: (A)Is there a significant difference in satisfaction
Q69: (A)State the appropriate null and alternative hypotheses
Q70: In an ANOVA test,the alternative hypothesis is
Q71: A recent study of educational levels of
Q72: (A)If you were to conduct a hypothesis
Q75: The owner of a popular Internet-based auction
Unlock this Answer For Free Now!
View this answer and more for free by performing one of the following actions

Scan the QR code to install the App and get 2 free unlocks

Unlock quizzes for free by uploading documents