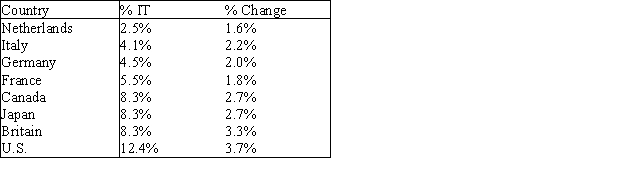
The table shown below contains information technology (IT)investment as a percentage of total investment for eight countries during the 1990s.It also contains the average annual percentage change in employment during the 1990s.Explain how these data shed light on the question of whether IT investment creates or costs jobs.(Hint: Use the data to construct a scatterplot)
Correct Answer:
Verified
View Answer
Unlock this answer now
Get Access to more Verified Answers free of charge
Q42: What other data would you need to
Q47: Economists believe that historically, countries with more
Q50: Approximate the percentage of these Internet users
Q53: Approximate the percentage of these internet users
Q55: Approximate the percentage of these Internet users
Q77: The following scatterplot compares the selling price
Q81: A car dealer collected the following information
Q84: Do these data help to confirm or
Q231: What percentage of the students in the
Q234: If the sample is a good representation
Unlock this Answer For Free Now!
View this answer and more for free by performing one of the following actions

Scan the QR code to install the App and get 2 free unlocks

Unlock quizzes for free by uploading documents