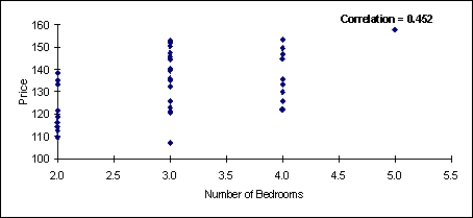
There are two scatterplots shown below.The first chart shows the relationship between the size of the home and the selling price.The second chart examines the relationship between the number of bedrooms in the home and its selling price.Which of these two variables (the size of the home or the number of bedrooms)seems to have the stronger relationship with the home's selling price? Justify your answer. 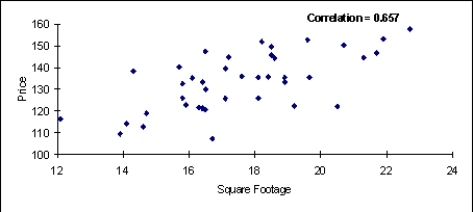
Correct Answer:
Verified
View Answer
Unlock this answer now
Get Access to more Verified Answers free of charge
Q45: Approximate the percentage of these Internet users
Q48: Approximate the percentage of these Internet users
Q50: Approximate the percentage of these Internet users
Q52: What percentage of these internet users has
Q67: What percentage of these Internet users who
Q70: A health magazine reported that a man's
Q222: Of those in the sample who did
Q233: If the sample is a good representation
Q235: If the sample is a good representation
Q237: Of those in the sample who went
Unlock this Answer For Free Now!
View this answer and more for free by performing one of the following actions

Scan the QR code to install the App and get 2 free unlocks

Unlock quizzes for free by uploading documents