Economists believe that historically, countries with more income inequality have had lower unemployment rates. For example, an economist in 1996 developed the table below containing the following information for 10 countries during the 1980-1995 time period:
· The change from 1980 to 1995 in ratio of the average wage of the top 10% of all wage earners to the median wage
· The change from 1980 to 1995 in unemployment rate.
Income inequality vs. Unemployment rate 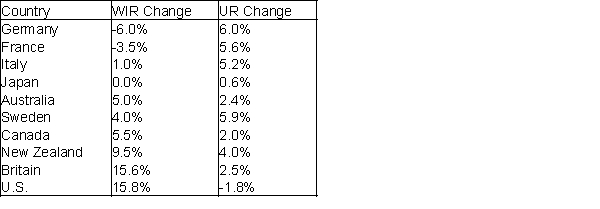
-Explain why the ratio of the average wage of the top 10% of all wage earners to the median measures income inequality.
Correct Answer:
Verified
View Answer
Unlock this answer now
Get Access to more Verified Answers free of charge
Q19: If the coefficient of correlation r =
Q42: What other data would you need to
Q43: An economic development researcher wants to understand
Q45: For which of the two variables, number
Q46: Suppose that the table shown below contains
Q46: Which two variables have the strongest linear
Q48: What does a scatterplot illustrate?
A) whether there
Q49: Data has been collected on store size
Q50: It is possible that the data points
Q52: Do these data help to confirm or
Unlock this Answer For Free Now!
View this answer and more for free by performing one of the following actions

Scan the QR code to install the App and get 2 free unlocks

Unlock quizzes for free by uploading documents