The data shown below contains family incomes (in thousands of dollars) for a set of 50 families sampled in 2007 and 2017. Assume that these families are good representatives of the entire United States. 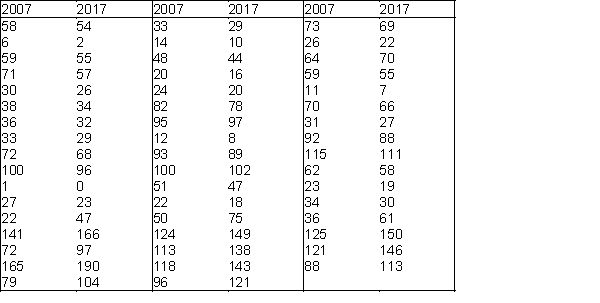
-Find the mean, median, standard deviation, first and third quartiles, and the 95th percentile for family incomes in both years.
Correct Answer:
Verified
Q31: Mean absolute deviation (MAD)is the average of
Q35: Unlike histograms,box plots depict only one aspect
Q56: A histogram is based on binning the
Q58: Expressed in percentiles, the interquartile range is
Q60: The average score for a class of
Q62: A political figure running for re-election claimed
Q63: What salary amount represents the second quartile?
Q64: A manager for Marko Manufacturing, Inc. has
Q65: Generate a box plot to summarize the
Q66: Calculate the interquartile range. What does this
Unlock this Answer For Free Now!
View this answer and more for free by performing one of the following actions

Scan the QR code to install the App and get 2 free unlocks

Unlock quizzes for free by uploading documents