The diagram on the right shows data from a single earthquake plotted on a diagram that shows the mathematical relationship between distance,magnitude,and S-wave amplitude.What do these data show? 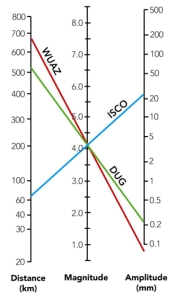
A) the distance between stations WUAZ and DUG is 680 km
B) station ISCO is 22 km from the earthquake epicenter
C) the local magnitude of the earthquake recorded by these three stations is 4.1 MI
D) station DUG was closest to the earthquake
Correct Answer:
Verified
Q27: How would this diagram change if the
Q28: The diagram on the right shows the
Q31: The continental block shown in this figure
Q32: Which of the following is true about
Q33: Where do most earthquakes occur near mid-ocean
Q35: Most large earthquakes on subduction zones occur
Q36: The Modified Mercalli Intensity rating map on
Q37: On this time-travel curve,if a large earthquake
Q38: Which of the following is a characteristic
Q57: How do we determine the location of
Unlock this Answer For Free Now!
View this answer and more for free by performing one of the following actions

Scan the QR code to install the App and get 2 free unlocks

Unlock quizzes for free by uploading documents