Based on the chart, what was the interquartile range of marks (approximately) . 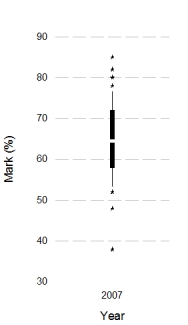
A) 7%
B) 22%
C) 47%
D) 14%
Correct Answer:
Verified
Q5: Imagine we took a group of smokers,
Q6: What does the graph below show?
Q7: Approximately what is the median success score
Q8: Looking at the graph below, which intervention
Q9: In IBM SPSS, the following graph is
Q11: Approximately what is the mean success score
Q12: Looking at the graph below, which of
Q13: What does a histogram show?
A)A histogram is
Q14: Which of the following statements best describes
Q15: In IBM SPSS, what is this graph
Unlock this Answer For Free Now!
View this answer and more for free by performing one of the following actions

Scan the QR code to install the App and get 2 free unlocks

Unlock quizzes for free by uploading documents