We took a sample of children who had been learning to play a musical instrument for five years. We measured the number of hours they spent practising each week and assessed their musical skill by how many of 8 increasingly difficult exams they had passed. We also asked them whether their parents forced them to practise or not (were their parents pushy?) . What does the following graph show? 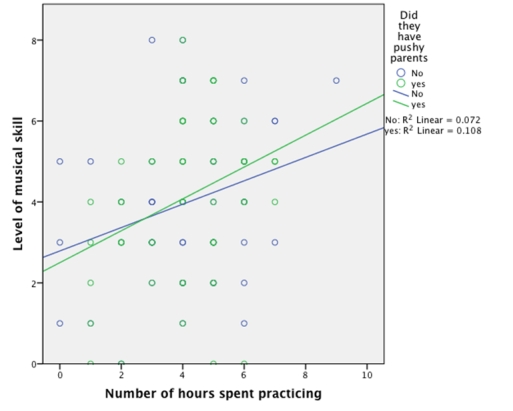
A) The more time spent practising, the more musically skilled the children were and this relationship was stronger for those who had pushy parents compared to those who did not.
B) The more time spent practising, the more musically skilled the children were, and this relationship was stronger for children who did not have pushy parents than for those who did.
C) Children with pushy parents always passed more grade exams than those without.
D) Practice causes better exam performance.
Correct Answer:
Verified
Q13: What does a histogram show?
A)A histogram is
Q14: Which of the following statements best describes
Q15: In IBM SPSS, what is this graph
Q16: Looking at the graph below, which intervention
Q17: Looking at the graph below, approximately what
Q18: What is the graph below known as?
Q19: A study was done to investigate the
Q20: What is this graph known as?
Q22: We took a sample of children who
Q23: The graph below shows the mean success
Unlock this Answer For Free Now!
View this answer and more for free by performing one of the following actions

Scan the QR code to install the App and get 2 free unlocks

Unlock quizzes for free by uploading documents