What is shown in the following graph? 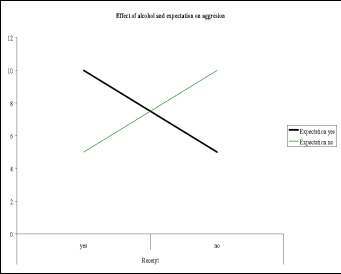
A) There is an interaction and no main effects.
B) There is one main effect and no interaction.
C) There are two main effects and no interaction.
D) There is an interaction and two main effects.
Correct Answer:
Verified
Q1: Breaking down a total variance is referred
Q2: If a study has employed a two-way
Q3: Why is Levene's test a useful test
Q4: Using the data in the table below,
Q5: Which procedure is not suitable for interpreting
Q7: Which of the following is a key
Q8: Which of the following is not a
Q9: Using the data in the table below,
Q9: How many dependent variables does a two-way
Q11: What is shown in the following graph?
Unlock this Answer For Free Now!
View this answer and more for free by performing one of the following actions

Scan the QR code to install the App and get 2 free unlocks

Unlock quizzes for free by uploading documents