Examine the following Q-Q plot from the pre-test control group. What can be assumed from the graph? 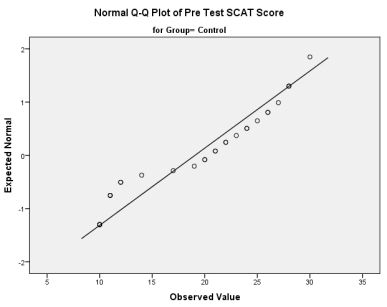
A) Data may not be normally distributed because the points deviate from the diagonal line.
B) Data are definitely not normally distributed because the points deviate from the diagonal line.
C) Data may be normally distributed because the points deviate from the diagonal line.
D) Data are definitely normally distributed because the points deviate from the diagonal line.
Correct Answer:
Verified
Q3: What factors are likely to influence the
Q4: Which of the following descriptions best explains
Q5: Calculate the effect size for the test
Q6: See the week 12 data in Q5
Q7: Which of the following are non-parametric tests?
A)
Q9: If we wanted to compare the pre-test
Q10: What were the effect sizes for the
Q11: Suppose you were interested in the longer-term
Q12: Which test can be considered the non-parametric
Q13: Run an appropriate test between the pre-test
Unlock this Answer For Free Now!
View this answer and more for free by performing one of the following actions

Scan the QR code to install the App and get 2 free unlocks

Unlock quizzes for free by uploading documents