Researchers were interested in finding out how the respiratory parameters in a group of individuals who were diagnosed with asthma responded to a six-week aerobic training intervention. Forced expired ratio (FER, %) is the product of the forced expired ratio in 1 second (FEV1, litres) divided by the forced vital capacity (FVC, litres) and was the parameter the researchers were most interested in. The results are presented below. Enter the data into SPSS and plot a bar chart representing the mean of the pre- and post-test data. Add the 95% confidence intervals for the mean. You should get the bar chart shown below. What does the 95% confidence interval (CI) that you have plotted refer to? 
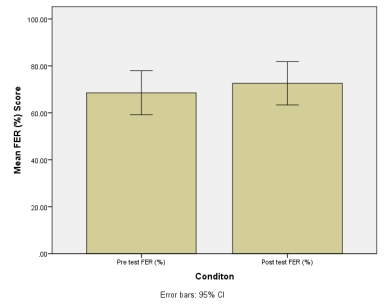
A) 95% confidence that the mean will fall between these intervals
B) 95% confidence that all data points fall between these intervals
C) 95% confidence that all data points fall outside these intervals
D) 95% confidence that the range falls between these intervals
Correct Answer:
Verified
Q8: Twenty-five percentile points is commonly referred to
Q9: Calculate the mean and standard deviation of
Q10: Why is it necessary to present numerical
Q11: Calculate the mean and standard deviation of
Q12: Which axis is the independent variable usually
Q14: Which measure of data distribution is presented
Q15: Which of the following is a type
Q16: Which of the following are important components
Q17: The interquartile range represents how many percentiles?
A)
Q18: A researcher randomized 75 children into three
Unlock this Answer For Free Now!
View this answer and more for free by performing one of the following actions

Scan the QR code to install the App and get 2 free unlocks

Unlock quizzes for free by uploading documents