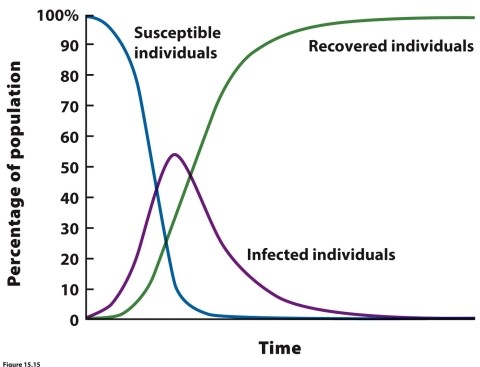
(Figure 15.15) In the figure showing dynamics of an infected population over time, what the curves A, B, and C represent?
Correct Answer:
Verified
View Answer
Unlock this answer now
Get Access to more Verified Answers free of charge
Q43: In S-I-R models, which of the following
Q44: Describe the 2-year cycle of Lyme disease,
Q47: Organisms that produce antibacterial or antifungal chemicals
Q48: Two populations with sample sizes of 25
Q52: Which of the following is NOT an
Q52: According to an S-I-R model, if a
Q55: The growth rates of two plant species
Q56: Which species is a reservoir for Borrelia
Q57: While you are conducting a study of
Q59: Researchers set up an experiment in which
Unlock this Answer For Free Now!
View this answer and more for free by performing one of the following actions

Scan the QR code to install the App and get 2 free unlocks

Unlock quizzes for free by uploading documents