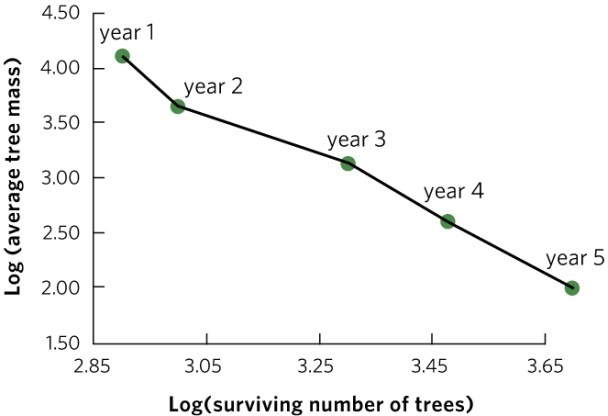
The graph shows one possible answer; students will have their own values. The figure should show log-transformed mass on the y axis and log-transformed survival on the x axis. The points they plot should form a negative slope.
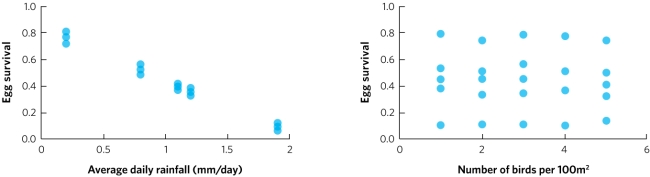
-A biologist studies a population of birds for 25 years. Each year the biologist records the amount of rainfall and the density of birds (number of birds per 100 square metres). Additionally, the biologist determines the survival rate for eggs laid that year. The biologist then plots egg survival rate against both rainfall (graph a) and bird density (graph b). In each plot the individual points represent the data for one year of the study. Based on these data, does this population of birds appear to have positive density-dependent population regulation, negative density-dependent population regulation, or density-independent population regulation? As part of your answer, list the prediction for each type of population regulation and explain whether the data meet that prediction.
Correct Answer:
Verified
View Answer
Unlock this answer now
Get Access to more Verified Answers free of charge
Q22: The logistic growth model describes a maximum
Q23: In the logistic growth model, which term
Q24: Which form of population growth results in
Q25: Alpine ibex are a type of wild
Q27: Which of the following statements about the
Q31: In the logistic growth model, in which
Q33: You are a biologist studying a small
Q34: A park biologist is planting saplings (young
Q37: Which is the most accurate statement about
Q40: Using the logistic growth model, draw a
Unlock this Answer For Free Now!
View this answer and more for free by performing one of the following actions

Scan the QR code to install the App and get 2 free unlocks

Unlock quizzes for free by uploading documents