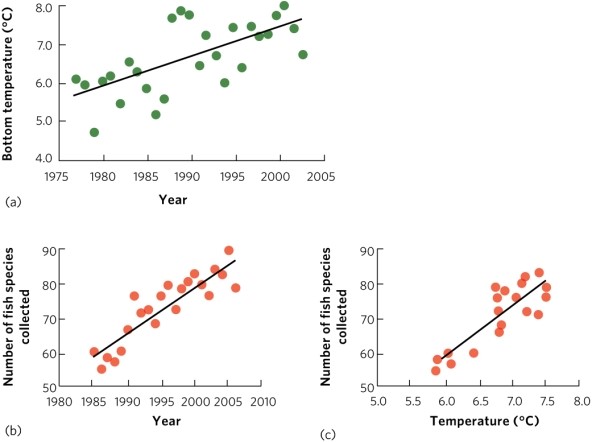
(Figure 11.5) Researchers examined data collected between 1985 and 2006 on diversity of fish in the North Sea, average bottom temperatures, and how species diversity was affected by temperature. According to the figure, what did they find? What did they conclude about the cause of the change in fish diversity?
Correct Answer:
Verified
View Answer
Unlock this answer now
Get Access to more Verified Answers free of charge
Q2: Species with very large geographic ranges that
Q6: Which dispersion should be favoured among plants
Q8: What was the main factor that led
Q9: What is the difference between a species'
Q11: The pattern of density and spacing of
Q13: The range of abiotic conditions under which
Q15: Populations whose individuals _ favour clustered dispersion.
A)
Q16: When there are direct interactions among individuals
Q17: Sugar maple (Acer saccharum) is a tree
Q18: What type of dispersion do many agricultural
Unlock this Answer For Free Now!
View this answer and more for free by performing one of the following actions

Scan the QR code to install the App and get 2 free unlocks

Unlock quizzes for free by uploading documents