Exhibit 10-14 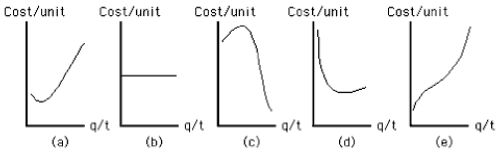
-Which of the curves shown in Exhibit 10-14 best represents the long-run average cost curve for an oligopolist?
A) Curve a
B) Curve b
C) Curve c
D) Curve d
E) Curve e
Correct Answer:
Verified
Q123: There are multiple models of pricing behavior
Q124: Something is called a barrier to entry
Q125: When there are barriers to entry, a
Q128: Interdependent decision making on price, quality, or
Q129: It is harder to explain the behavior
Q132: In oligopoly, minimum efficient scale is large
Q133: Oligopolists are more sensitive to the pricing
Q135: In an oligopoly, the demand curve facing
Q137: The defining characteristic of oligopoly is product
Q139: For firms in an oligopoly to be
Unlock this Answer For Free Now!
View this answer and more for free by performing one of the following actions

Scan the QR code to install the App and get 2 free unlocks

Unlock quizzes for free by uploading documents