Figures A and B show the effect of a late- and an early acting mutation on the lifetime fitness of individuals. Reproduction begins at day 30. Using the graphs, how would you determine which of the two mutations had a greater effect on lifetime fitness? 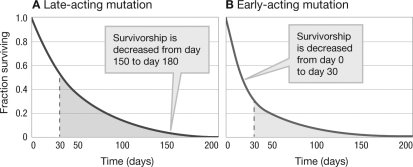
Correct Answer:
Verified
View Answer
Unlock this answer now
Get Access to more Verified Answers free of charge
Q37: Does this graph provide evidence in support
Q38: Use one of Randy Nesse and George
Q39: Many wild mushrooms make delicious food, but
Q40: Explain how ectothermic animals can produce a
Q41: Imagine a population of snails that is
Q43: Which of the two viral phylogenies below
Q44: Describe the effects of a mutation that
Q45: Explain why it was beneficial for primitive
Q46: Define pathogen-associated molecular patterns (PAMPs), and explain
Q47: Consider an organism that experiences senescence. Draw
Unlock this Answer For Free Now!
View this answer and more for free by performing one of the following actions

Scan the QR code to install the App and get 2 free unlocks

Unlock quizzes for free by uploading documents