What does this figure tell us about diversification and effective population size in the Y chromosome and mtDNA? 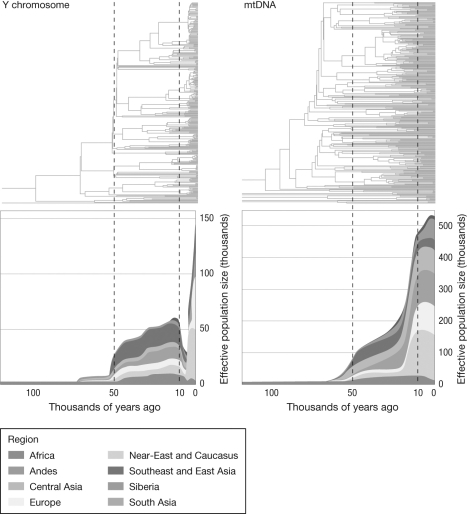
A) Y chromosome diversity and effective population size decreased dramatically during the migration out of Africa, followed by a significant increase in effective population size. mtDNA diversity and effective population size dramatically increased and is significantly larger than that of the Y chromosome.
B) Y chromosome diversity and effective population size increased dramatically during the migration out of Africa, followed by a severe restriction in effective population size. mtDNA diversity and effective population size dramatically increased and is significantly larger than that of the Y chromosome.
C) Both diversity and effective population size increased steadily and significantly for the Y chromosome and mtDNA during the migration out of Africa and are now approximately equivalent to each other.
D) Y chromosome diversity and effective population size decreased during the migration out of Africa and then recovered to become approximately equivalent to mtDNA.
Correct Answer:
Verified
Q12: What was the major transition from archaic
Q13: What is meant by describing modern human
Q14: What are the distinguishing features of the
Q15: Who was "mitochondrial Eve" and how does
Q16: Deep coalescence in molecular data is most
Q18: Gene trees for modern human populations were
Q19: How do Neanderthals physically differ from modern
Q20: Which of the following most accurately describes
Q21: Why was the fossil evidence for interbreeding
Q22: Which of the following describes how Homo
Unlock this Answer For Free Now!
View this answer and more for free by performing one of the following actions

Scan the QR code to install the App and get 2 free unlocks

Unlock quizzes for free by uploading documents