The figure shows (A) a cladogram of primates and (B) a phylogram of primate lentiviruses. What do the branch lengths in each phylogeny represent? A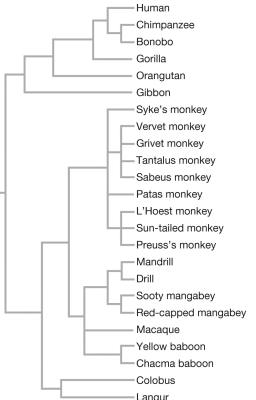
B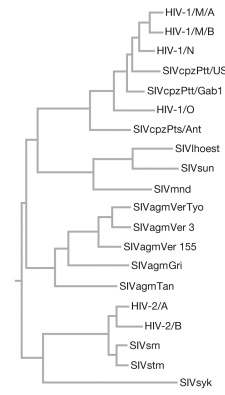
Correct Answer:
Verified
View Answer
Unlock this answer now
Get Access to more Verified Answers free of charge
Q18: In the figure, the shrublike or treelike
Q19: If the tree shown in the figure
Q20: Which of the following is Carolus Linnaeus
Q21: Aposematic, or warning, coloration in poison frogs
Q22: The figure shows the phylogeny of snakes,
Q24: Examine the tree of life of all
Q25: Analogous traits are found in two or
Q26: Phylogenies can be used to distinguish homologous
Q27: The figure shows where tetrapod limbs evolved
Q28: Both the process of reconstructing phylogenies and
Unlock this Answer For Free Now!
View this answer and more for free by performing one of the following actions

Scan the QR code to install the App and get 2 free unlocks

Unlock quizzes for free by uploading documents