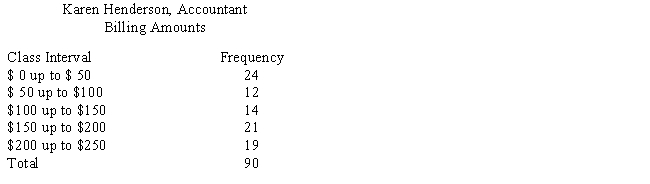
In June, Karen Henderson, an accountant, examined her records to learn the amount she had billed each of the first 90 clients who had contacted her at the beginning of the year for income tax advice. The results of the survey appear in the following table. Use Figure 24-4 to construct a histogram to illustrate this data. Label where necessary.
Correct Answer:
Verified
Q17: Construct a frequency distribution for the set
Q18: Construct a frequency distribution for the set
Q19: Compute the mean, median, and mode of
Q20: Mean:
_
b.Median:
_
c.Mode:
_
Q21: Last year, David Lum opened a new
Q23: The table below displays the quarterly revenue
Q24: David Lum operates two pharmacies, one near
Q25: The table below displays the quarterly revenues
Q26: David Lum operates two pharmacies, one near
Q27: Use Figure 24-3 to construct a histogram
Unlock this Answer For Free Now!
View this answer and more for free by performing one of the following actions

Scan the QR code to install the App and get 2 free unlocks

Unlock quizzes for free by uploading documents