Referring to this graph of ice cream fat content,the second quartile is between 60 and 61. 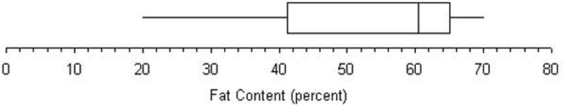
Correct Answer:
Verified
Q5: The second quartile is the same as
Q22: When applying the Empirical Rule to a
Q22: The range as a measure of variability
Q25: Which is a characteristic of the mean
Q26: A sample consists of the following data:
Q27: Referring to this box plot of ice
Q28: A leptokurtic distribution is more sharply peaked
Q29: Referring to this box plot of ice
Q30: A platykurtic distribution is more sharply peaked
Q34: Outliers are data values that fall beyond
Unlock this Answer For Free Now!
View this answer and more for free by performing one of the following actions

Scan the QR code to install the App and get 2 free unlocks

Unlock quizzes for free by uploading documents