The mean of a population is 50 and the median is 40.Which histogram is most likely for samples from this population? 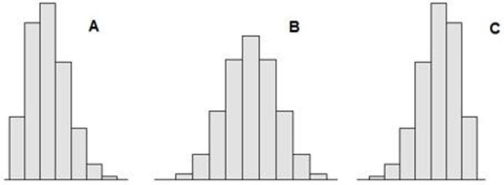
A) Sample A.
B) Sample B.
C) Sample C.
Correct Answer:
Verified
Q103: Which statement is false? Explain.
A)If μ =
Q105: Which is not a measure of variability?
A)Mean
Q123: Patient waiting times in the Tardis Orthopedic
Q126: In Osaka, Japan, stock brokers earn ×6000
Q129: Eleven students were asked how many siblings
Q136: Twelve students were asked how many credit
Q139: If Q1 = 150 and Q3 =
Q141: Briefly describe these data.Sketch its box plot
Q142: A team of introductory statistics students went
Q143: Below are the ages of 21 CEOs.Find
Unlock this Answer For Free Now!
View this answer and more for free by performing one of the following actions

Scan the QR code to install the App and get 2 free unlocks

Unlock quizzes for free by uploading documents