Figure 2-18
Relationship between Price and Restaurant Meals 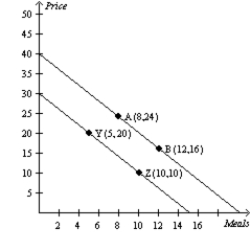
-Refer to Figure 2-18. The slope of the line containing points Y and Z is
A) -0.5.
B) -2.
C) -4.
D) -1.
Correct Answer:
Verified
Q41: Figure 2-18
Relationship between Price and Restaurant Meals
Q43: Figure 2-18
Relationship between Price and Restaurant Meals
Q52: Figure 2-18
Relationship between Price and Restaurant Meals
Q54: Figure 2-18
Relationship between Price and Restaurant Meals
Q56: Suppose that someone makes the argument that
Q61: Figure 2-20
Relationship Between Years of Education and
Q64: Alfonso has noticed that increases in unemployment
Q67: Figure 2-19
In the following graph the x-axis
Q68: Figure 2-19
In the following graph the x-axis
Q402: The slope of a line that passes
Unlock this Answer For Free Now!
View this answer and more for free by performing one of the following actions

Scan the QR code to install the App and get 2 free unlocks

Unlock quizzes for free by uploading documents