Figure 2-18
Relationship between Price and Restaurant Meals 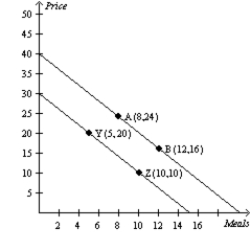
-Refer to Figure 2-18. The slope of the line containing points A and B is
A) -1/2.
B) 1/2.
C) 2.
D) -2.
Correct Answer:
Verified
Q2: While the scientific method is applicable to
Q8: Economists try to address their subject with
Q14: The scientific method is the dispassionate development
Q44: A relatively steep demand curve indicates that
A)quantity
Q46: When income increases the slope of an
Q58: The slope of a line passing through
Q62: In the early 19th century,the Russian government
Q63: The argument that purchases of minivans cause
Q65: Figure 2-20
Relationship Between Years of Education and
Q66: Figure 2-20
Relationship Between Years of Education and
Unlock this Answer For Free Now!
View this answer and more for free by performing one of the following actions

Scan the QR code to install the App and get 2 free unlocks

Unlock quizzes for free by uploading documents