Multiple Choice
Figure 5-9 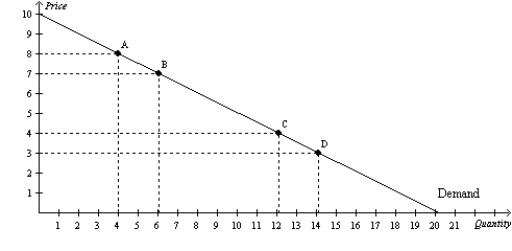
-Refer to Figure 5-9. Using the midpoint method, the price elasticity of demand between point A and point B is
A) 0.33.
B) 0.5.
C) 2.0.
D) 3.0.
Correct Answer:
Verified
Related Questions
Q198: Income elasticity of demand measures how
A)the quantity
Q216: Figure 5-6 Q217: Figure 5-8 Q221: Figure 5-11 Q242: For which of the following goods is Q246: To determine whether a good is considered Unlock this Answer For Free Now! View this answer and more for free by performing one of the following actions Scan the QR code to install the App and get 2 free unlocks Unlock quizzes for free by uploading documents![]()
![]()
![]()

