Essay
Use the following graph shown to fill in the table that follows. 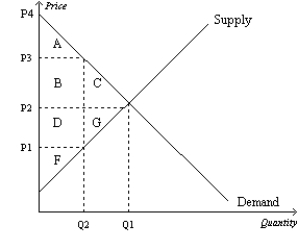

Correct Answer:
Verified
Related Questions
Q45: The deadweight loss of a tax rises
Q46: The result of the large tax cuts
Q53: Suppose that a university charges students a
Q54: Economist Arthur Laffer made the argument that
Q55: If the size of a tax triples,
Q57: If the size of a tax doubles,
Q59: The optimal tax is difficult to determine
Q101: Using demand and supply diagrams, show the
Q118: John has been in the habit of
Q449: Suppose that instead of a supply-demand diagram,
Unlock this Answer For Free Now!
View this answer and more for free by performing one of the following actions

Scan the QR code to install the App and get 2 free unlocks

Unlock quizzes for free by uploading documents