Multiple Choice
Figure 18-1
On the graph, L represents the quantity of labor and Q represents the quantity of output per week. 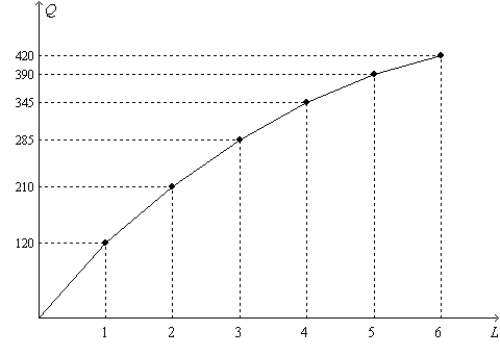
-Refer to Figure 18-1. Based on the shape of the curve, the
A) (i) only
B) (i) and (iii) only
C) (i) and (iv) only
D) (ii) and (iv) only
Correct Answer:
Verified
Related Questions

