The diagram below represents a model that the U.S.Geological Survey (USGS) uses to categorize the extent of storm surge in the coastal zone.The red arrow in this figure points to 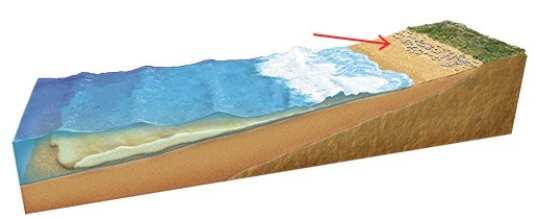
A) the maximum height of the swash zone.
B) the highest rate of discharge from the nearest stream.
C) the radius of motion of water molecules that are part of the waves of oscillation.
D) the height of high tide.
Correct Answer:
Verified
Q70: Three damaging hurricanes on the U.S.Atlantic and
Q71: Long Island and Cape Cod both were
Q72: In the coastlines investigation,what coastline process is
Q73: In the coastlines investigation,what coastline process is
Q74: In the coastlines investigation,what do the embayments
Q76: In the coastlines investigation,what coastline feature consists
Q77: Based on the features on this island
Q78: What caused a relative rise in sea
Q79: During a hurricane or other strong coastal
Q80: In the coastlines investigation,what coastline feature is
Unlock this Answer For Free Now!
View this answer and more for free by performing one of the following actions

Scan the QR code to install the App and get 2 free unlocks

Unlock quizzes for free by uploading documents