Colors on this map of an imaginary country represent mean annual temperatures (reds above 28 degrees Celsius,blue and purple below 0 degrees Celsius) . In classifying the climate of this imaginary country,the hottest and driest areas are in the 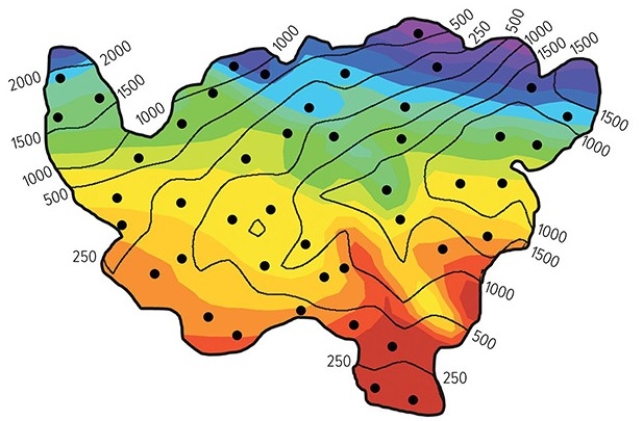
A) northeast.
B) southeast.
C) southwest.
D) northwest.
Correct Answer:
Verified
Q11: Observe where the sun is overhead for
Q12: What line or region best corresponds with
Q13: Colors on this map of an imaginary
Q14: Which of the following best describes the
Q15: Köppen's intent in developing his climatic classification
Q17: Where there are abrupt changes in elevation,climate
Q18: Given that climate correlates closely with vegetation,what
Q19: Given that climate correlates closely with vegetation,what
Q20: Using the Köppen classification system,a climate classified
Q21: Good examples of Marine West Coast Climates
Unlock this Answer For Free Now!
View this answer and more for free by performing one of the following actions

Scan the QR code to install the App and get 2 free unlocks

Unlock quizzes for free by uploading documents