The accompanying graph shows the number of Atlantic hurricanes since the 1880s.Based on when most global warming has occurred,one would conclude 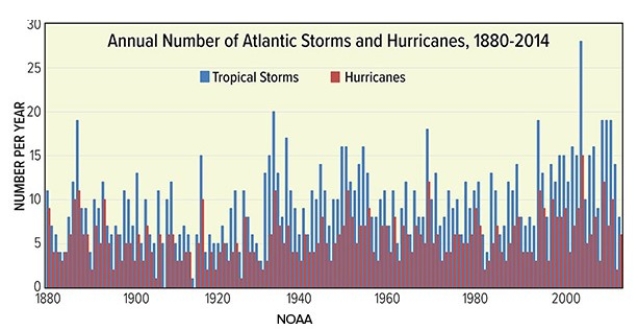
A) short duration hurricanes have increased in frequency.
B) all hurricanes have increased in frequency.
C) moderate duration hurricanes have increased in frequency.
D) no trends are apparent from this graph.
Correct Answer:
Verified
Q67: Ultimately,positive and negative feedbacks on Daisy World
Q68: In the last 200 years,sea level has
Q69: This globe,from the opening two-page spread of
Q70: Which of the following is not likely
Q71: Which of the following is a correct
Q73: Which of the following sites on this
Q74: This globe,from the opening two-page spread of
Q75: This globe,from the opening two-page spread of
Q76: On the hypothetical Daisy World planet,white daisies
Q77: On the hypothetical Daisy World planet,black daisies
Unlock this Answer For Free Now!
View this answer and more for free by performing one of the following actions

Scan the QR code to install the App and get 2 free unlocks

Unlock quizzes for free by uploading documents