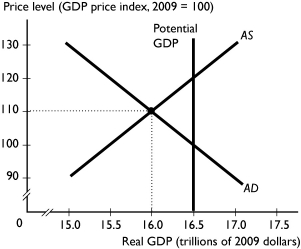
-In the figure above,the economy is at an equilibrium with real GDP of $16 trillion and a price level of 110.As the economy moves toward its ultimate equilibrium,the ________ curve shifts ________ because ________.
A) aggregate supply;leftward;the money wage rate rises
B) aggregate supply;rightward;the money wage rate falls
C) aggregate demand;rightward;the money wage rate falls
D) aggregate demand;leftward;the money wage rate rises
E) potential GDP;leftward;the money wage rate falls
Correct Answer:
Verified
Q195: Demand pull inflation can be started by
A)a
Q196: Q197: If demand pull inflation occurs when the Q198: A demand-pull inflation consists of _ shifts Q199: Initially,demand-pull inflation will Q201: By itself,an increase in the price of Q202: If oil prices increase,then in the short Q203: In the short-run,an increase in the price Q204: Cost-push inflation can start with Q205: Cost-push inflation can be started by![]()
A)increase the price level and
A)a decrease in
A)a decrease
Unlock this Answer For Free Now!
View this answer and more for free by performing one of the following actions

Scan the QR code to install the App and get 2 free unlocks

Unlock quizzes for free by uploading documents