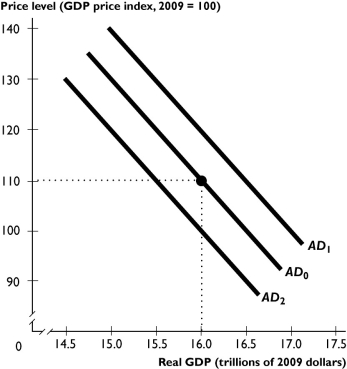
 The figure above shows aggregate demand curves.
-Based on the figure above,the aggregate demand curve will shift from AD0 to AD2 when
A) potential GDP increases.
B) the price level falls.
C) the price level rises.
D) government expenditure decreases.
E) the Federal Reserve lowers the interest rate.
Correct Answer:
Verified
Q245: A decrease in investment leads to _
Q246: In the late 1920s,the U.S.economy experienced a
Q247: The _,the _ is the quantity of
Q248: Q249: Q251: When the macroeconomic equilibrium is such that Q252: _ increases potential GDP. Q253: When the macroeconomic equilibrium is such that Unlock this Answer For Free Now! View this answer and more for free by performing one of the following actions Scan the QR code to install the App and get 2 free unlocks Unlock quizzes for free by uploading documents![]()
![]()
A)A decrease in the

