 The figure above shows aggregate demand curves.
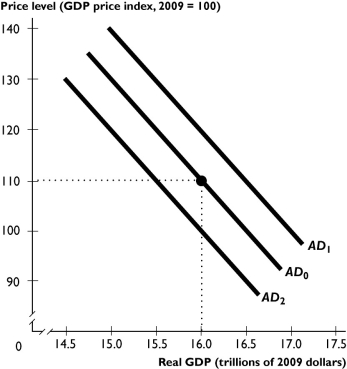
-Based on the figure above,the aggregate demand curve will shift from AD0 to AD2 when
A) potential GDP increases.
B) the price level falls.
C) taxes are lowered.
D) government expenditure increases.
E) the Federal Reserve raises the interest rate.
Correct Answer:
Verified
Q50: The aggregate supply curve shifts
A)rightward if potential
Q254: Q255: During the late 1960s,U.S.defense spending increased as Q257: An increase in the price level _ Q258: A recession in the rest of the Q260: Unemployment increases when Q261: List three changes that lead to a Q262: If the AD curve shifts rightward,then Q263: An economy is at a full-employment equilibrium,and Q264: Does a rise in the price level![]()
A)an inflationary gap is created.
B)potential
A)both the
Unlock this Answer For Free Now!
View this answer and more for free by performing one of the following actions

Scan the QR code to install the App and get 2 free unlocks

Unlock quizzes for free by uploading documents