Multiple Choice
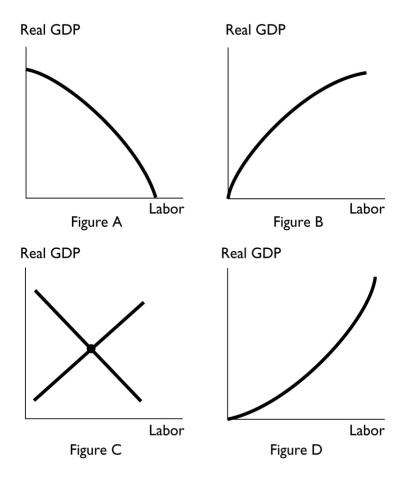
-The above figure that most accurately shows a production function is
A) Figure A.
B) Figure B.
C) Figure C.
D) Figure D.
E) Both Figure A and Figure B;Figure A for an economy with an excess of labor and Figure B for an economy with a shortage of labor.
Correct Answer:
Verified
Related Questions
Q52: Q53: As the quantity of labor employed increases,the Q54: As more labor is hired,moving along the Q55: In 2011,real GDP in the United States![]()
Unlock this Answer For Free Now!
View this answer and more for free by performing one of the following actions

Scan the QR code to install the App and get 2 free unlocks

Unlock quizzes for free by uploading documents