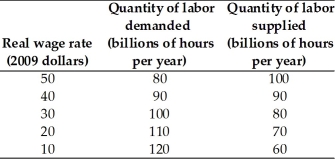
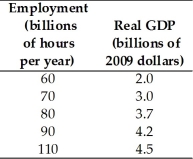
-The tables above show a nation's labor demand and labor supply schedules and its production function.The equilibrium real wage rate is ________ and the equilibrium quantity of labor is ________ billion hours per year.
A) $50;100
B) $40;90
C) $30;80
D) $40;80
E) $20;110
Correct Answer:
Verified
Q107: In a labor market without an efficiency
Q108: When the labor market is in equilibrium,real
Q109: Potential GDP
A)is the quantity of GDP produced
Q110: With fixed quantities of capital,land,and entrepreneurship and
Q111: Economic growth is a sustained expansion of
Q113: The real wage rate is $35 an
Q114: Economic growth is defined as
A)a decrease in
Q115: Economic growth is defined as equal to
Q116: In the United States between the 1970s
Q117: _ adopts the view that aggregate fluctuations
Unlock this Answer For Free Now!
View this answer and more for free by performing one of the following actions

Scan the QR code to install the App and get 2 free unlocks

Unlock quizzes for free by uploading documents