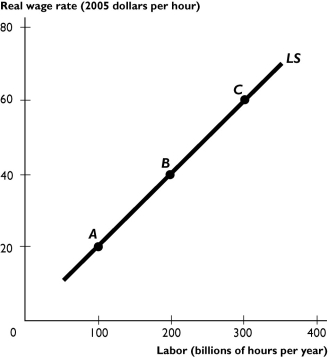
-The figure above shows the U.S.supply of labor curve.An increase in the income tax rate leads to a
A) rightward shift of the supply of labor curve.
B) movement upward along the supply of labor curve from a point such as C to a point such as B.
C) movement downward along the supply of labor curve from a point such as A to a point such as B.
D) leftward shift of the supply of labor curve.
E) None of the above answers is correct because there is no change in the supply of labor curve.
Correct Answer:
Verified
Q281: The presence of government corruption in some
Q281: Define potential GDP.Under what circumstances does actual
Q282: Briefly define real and potential GDP,and explain
Q283: If the government raises income taxes,then the
Q284: Q285: Economic growth is enhanced by Q287: The fastest growing nations today are those Unlock this Answer For Free Now! View this answer and more for free by performing one of the following actions Scan the QR code to install the App and get 2 free unlocks Unlock quizzes for free by uploading documents![]()
A)free international trade.
B)limiting

