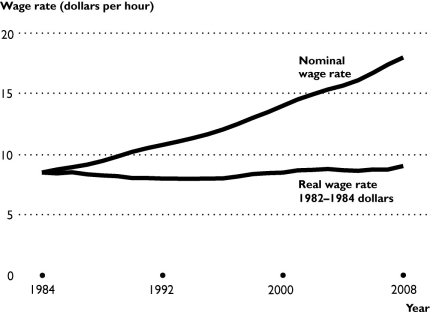
-The trends displayed in the table can best be explained by
A) the nominal wage rate has increased at a rate about equal to the inflation rate.
B) the real wage rate has increased at a rate about equal to the inflation rate.
C) service industries have increased as a proportion of the economy and they tend to have higher nominal wage rates.
D) the inflation rate has been rising over the time period.
E) None of the above can explain the trends in the figure.
Correct Answer:
Verified
Q233: In 2011,apples cost $1.49 a pound.Suppose the
Q234: In the United States for the last
Q235: If real GDP is greater than nominal
Q236: In 1970 the CPI was 39,and in
Q239: Nominal GDP was $12.1 trillion and real
Q240: You borrow at a nominal interest rate
Q241: If the base year CPI market basket
Q243: Last year the CPI was 177.1 and
Q374: Assume that after you graduate, you move
Q378: "The market basket used to calculate the
Unlock this Answer For Free Now!
View this answer and more for free by performing one of the following actions

Scan the QR code to install the App and get 2 free unlocks

Unlock quizzes for free by uploading documents