Multiple Choice
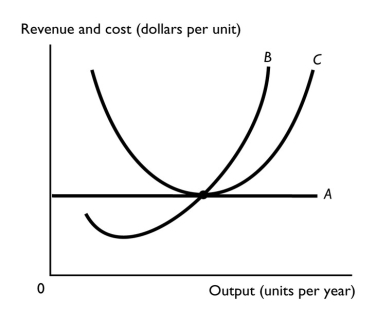
-The above figure illustrates a perfectly competitive firm.Curve C represents the
A) MR curve.
B) ATC curve.
C) MC curve.
D) market demand curve.
E) AFC curve.
Correct Answer:
Verified
Related Questions
-The above figure illustrates a perfectly competitive firm.Curve C represents the
A) MR curve.
B) ATC curve.
C) MC curve.
D) market demand curve.
E) AFC curve.
Correct Answer:
Verified

