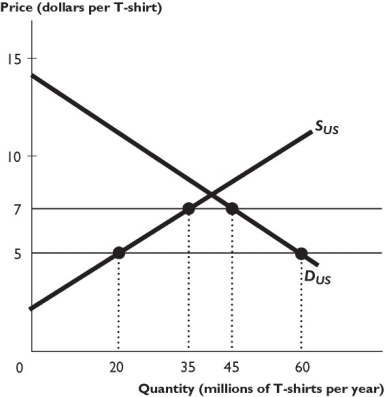
The figure above shows the U.S. market for T-shirts, where SUS is the domestic supply curve and DUS is the domestic demand curve. The world price of a T-shirt is $5. The U.S. government imposes a $2 per unit tariff on imported T-shirts.
-The figure above shows that as a result of the tariff,the price of a T-shirt in the United States ________,and the quantity of T-shirts bought ________.
A) rises by $2; decreases by 15 million per year
B) rises by $2; increases by 15 million per year
C) falls by $2; increases by 5 million per year
D) does not change; decreases by 5 million per year
E) does not change; does not change
Correct Answer:
Verified
Q220: The _ are hurt by importing a
Q221: Q222: Assume that the state of Missouri decided Q223: Q224: Q226: Q227: Q228: In the 1980s,the U.S.government forced Japanese automakers Q229: In the 1950s,crude oil and natural gas Q230: Unlock this Answer For Free Now! View this answer and more for free by performing one of the following actions Scan the QR code to install the App and get 2 free unlocks Unlock quizzes for free by uploading documents![]()
![]()
![]()
![]()
![]()
![]()

