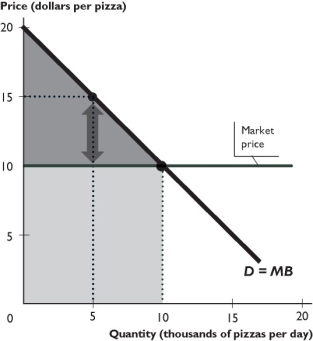
The figure above shows the demand curve for pizza and the market price of pizza.
-In the figure above,what is the consumer surplus per day?
A) $100,000
B) $50,000
C) $125,000
D) $150,000
E) zero
Correct Answer:
Verified
Q266: In December 2010,Kansas had a severe ice
Q267: Q268: Which of the following is part of Q269: Q270: Which of the following is an example Q272: Why does redistribution,so that the distribution of Q273: In the figure above,when 2,000 pizzas are Q274: In the figure above,production efficiency occurs at Q275: If the government takes over the distribution Q276: In the figure above,when 4,000 pizzas are![]()
![]()
Unlock this Answer For Free Now!
View this answer and more for free by performing one of the following actions

Scan the QR code to install the App and get 2 free unlocks

Unlock quizzes for free by uploading documents