Multiple Choice

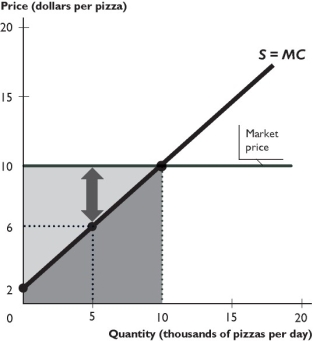
The figure above shows the supply curve for pizza and the market price of pizza.
-In the figure above,the cost of producing 10,000 pizzas a day is
A) $60,000.
B) $100,000.
C) $40,000.
D) $80,000.
E) $50,000.
Correct Answer:
Verified
Related Questions
Q259: Which of the following can result in
Q260: The "equality of opportunity" idea of fairness
Q261: The idea that unequal incomes are unfair
Q262: In the figure above,when 6,000 pizzas are
Q263: Q265: As pointed out by the "big tradeoff," Q266: In December 2010,Kansas had a severe ice Unlock this Answer For Free Now! View this answer and more for free by performing one of the following actions Scan the QR code to install the App and get 2 free unlocks Unlock quizzes for free by uploading documents![]()

