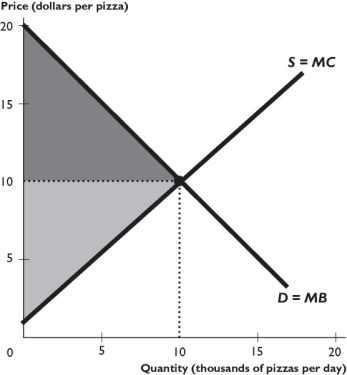
The figure above shows the market for pizza.
-In the figure above,when the market is in equilibrium,marginal benefit ________ marginal cost,so the quantity of pizza produced is ________.
A) equals; efficient
B) exceeds; efficient
C) is below; efficient
D) is below; not efficient
E) exceeds; not efficient
Correct Answer:
Verified
Q287: Q288: If an economy is producing on its Q289: Q290: Q291: Q293: When a society achieves production efficiency,it is Q294: If society can produce more of one Q295: Production efficiency requires that Q296: When society must decrease the production of Q297: Unlock this Answer For Free Now! View this answer and more for free by performing one of the following actions Scan the QR code to install the App and get 2 free unlocks Unlock quizzes for free by uploading documents![]()
![]()
![]()
![]()
A)
A) the economy be![]()

