Short Answer
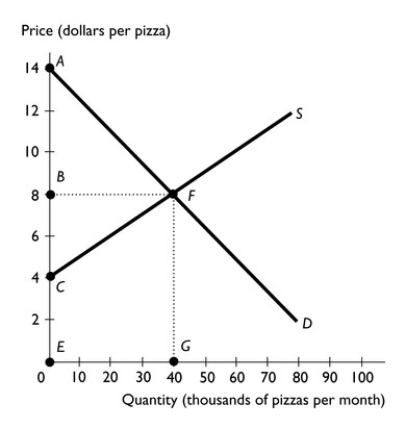
-The figure above shows the supply and demand curves for pizza.If the market is at its competitive equilibrium,what area in the graph above represents:
a.consumer surplus?
b.producer surplus?
Correct Answer:
Verified
Related Questions
Q14: What is consumer surplus?
Q58: What is the "invisible hand"?
Q337: The demand curve is the same as
Q339: What are the two ways demand curves
Q340: the quantity demanded at a given price.In
Q345: Jason wants to hire Maria to tutor
Q346: Briefly describe the concept of the "invisible
Q398: What is the "big tradeoff"?
Unlock this Answer For Free Now!
View this answer and more for free by performing one of the following actions

Scan the QR code to install the App and get 2 free unlocks

Unlock quizzes for free by uploading documents