Multiple Choice
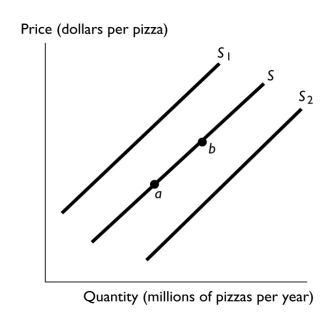
-In the above figure,the shift in the supply curve from S to S1 reflects
A) an increase in the quantity of pizza supplied.
B) a decrease in the quantity of pizza supplied.
C) an increase in the supply of pizza.
D) a decrease in the supply of pizza.
E) None of the above answers is correct.
Correct Answer:
Verified
Related Questions
Q121: Q123: Because of the high cost of fuel,railroads Q127: Q128: The number of corn producers increases,so the Q129: Which of the following increases the supply![]()
![]()

