Multiple Choice
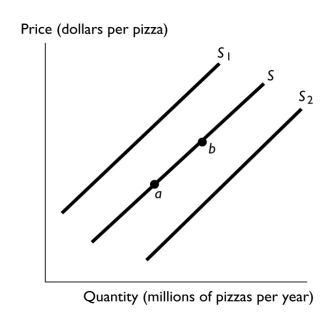
-In the above figure,the shift in the supply curve from S to S2 might reflect
A) a decrease in the cost of the tomato sauce used to produce pizza.
B) a decrease in the number of pizza producers.
C) an increase in the price of a pizza.
D) an increase in income if pizza is a normal good.
E) an increase in the price of a good that is a substitute for consumers.
Correct Answer:
Verified
Related Questions

