Essay
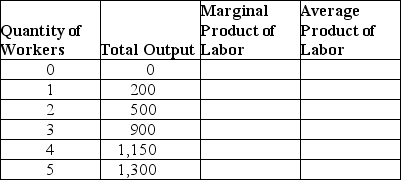
Fill in the missing values in the following table.Draw one graph showing how total output increases with the quantity of workers hired,and another graph showing the marginal product of labor and the average product of labor.
Correct Answer:
Verified
Related Questions

